Test-driving assemblies of Oxford Nanopore data, and Illumina-polishing
What is our interest in nanopore?
We wear a couple of different hats in my research group. Part of the time we spend developing new data structures and methods for representing genetic variation, which is a subject of a future post. But we are also interested in applications of sequencing to problems in clinical microbiology. Anyone reading this blog is likely to have heard of the Oxford Nanopore MinION sequencer, and to be aware it is a USB-stick-sized single molecule sequencing machine that generates reads in real time. There are many obvious benefits to having a cheap, fast, portable, long read sequencer, especially in a clinical setting where you don’t want to wait until you have enough sick people to justify a MiSeq run. But for this analysis, we wanted to know how well whole-genome assembly works with nanopore data, and how close to a finished genome can you get. Of course, once you push the boundaries, it gets hard to define finished, as samples continue to evolve during culture, and there is no Heaven-sent Truth for us to use. However if we can get an assembly that is highly concordant with a high-quality polished/manually studied PacBio assembly, then I’m going to be happy.
By the way, all of this analysis is the work of Rachel Norris, a PhD student in Zam’s group. We both wrote the post, so you may find it switches confusingly from “I” to “we” in places (sorry).
What have we done
Oxford Nanopore MinIONs generate data with a relatively high error rate for someone accustomed to Illumina data, but these errors are supposed to be sufficiently random for consensus to iron out any issues. Errors are not uniformly distributed either spatially across the read (in fact they are bursty), or in terms of error-type as there is some context dependence.
There are now several pipelines for de novo assembly of Oxford Nanopore data, including the following:
- Nick Loman, Josh Quick and Jared Simpson (henceforth LQS) created a pipeline which uses nanocorrect, Celera Assembler and 2 rounds of nanopolish.
- Adam Phillippy’s group have a PBcR pipeline which takes advantage of the MinHash Alignment Process (MHAP) and the Celera Assembler in PBcR, before running 2 rounds of nanopolish.
- Heng Li’s miniasm, which does no correction, but instead tries to assemble straight away.
All of these pipelines work purely with nanopore data, and we wanted to know how much improvement you could get by combining with Illumina short reads. Since the assembled contigs were likely to differ from the truth by indels, and potentially clustered indels, we did not want to use any method based on pileups. Instead, we thought as a baseline we should see how well de Bruijn graph correction worked, as we have a lot of experience of this. Hence, we came up with Poligraph: a tool for polishing de-novo nanopore assemblies with reads (usually miseq) using de bruijin graphs. It is essentially a wrapper for calling differences between the draft assembly and a set of (high quality) reads with cortex, and using them to update the assembly.
How does poligraph work?
Poligraph is a simple wrapper around Cortex, available here on Github. A typical command-line might be
perl poligraph.pl --draft_assembly PBcR_assembly.fa --reads_fq illumina.fastq --base_dir dir_to_work_from --global --cortex_dir path/to/cortex --vcftools_dir path/to/vcftools --stampy_bin path/to/stampy.py
The correction process builds a ‘reference’ de Bruijn graph structure of the draft assembly, and a second graph of the high quality reads using cortex. The read graph is cleaned to remove noise. Cortex then creates a vcf of ‘bubble calls’ between the ‘reference’ and the reads, and these calls are used to update the assembly. Polishing a bacterial sample takes 5-10 minutes on a single core. Poligraph is not expected to be a state-of-the-art super-polisher - we just intended it as a fast baseline method, robust to the indel errors we might see in a nanopore assembly.
How does it perform?
We’re going to measure assembly in 4 ways:
- Number of contigs (in the days of Illumina assemblies we might have talked about N50 etc, but here we simply aim for a single contig assembly)
- Structural accuracy – we align using Mummer to a high quality finished assembly for the same sample.
- Local per-base accuracy, using dnadiff.
- Number of SNP and indel errors remaining
Dataset 1: E Coli K-12 MG1655 (SQK0005)
Nick Loman has very helpfully made an E Coli K-12 MG1655 dataset available, along with reads from successive different nanopore chemistries. Multiple different groups have used these data to test their tools, which provides us with data to compare with. We started with the chemistry version SQK005. This is the data that LQS used to produce a single contig assembly in their paper.
Tables of results for these assemblies:
| LQS | PBcR | Miniasm | |
|---|---|---|---|
| Aligned Bases | 99.97% | 99.96% | 78.85% |
| Percent Identity for Aligned Bases | 99.47% | 99.24% | (84.05%) |
| Number of Contigs | 3 | 1 | 1 |
| Number of SNPs | 1357 | 4115 | (246377) |
| Number of Indels | 22622 | 30838 | (365081) |
| Time | 2 weeks | 34 hours | 2mins |
The first thing to note is that both the LQS and Phillippy group assembly pipelines performed a correction step before assembly and a polishing step afterwards. For a fair comparison, I should have at least run 2 rounds of nanopolishing on the miniasm assembly as well, but when I tried this on a different sample it took 5 days on 16 cores to run just one round, so we ended up postponing - hence those figures are in brackets.
Various things we see:
- The LQS assembly has 3 contigs, whereas in their paper they achieved 1 contig. We’ll need to contact them and debug this.
- As expected the (unpolished) miniasm assembly has 100x more SNPs (one every 20bp) and 10x more indels than the other assemblies.
- Two weeks for the LQS assembly does rather ruin the benefit of rapid MinION sequencing, but it does leave us time for an Illumina run ;-)
- We don’t know if the low %aligned bases for the miniasm assembly is due to the high error rate, or missing sequence/collapsed repeats (but see below..)
These results are astonishing - not an honest-to-god shock as we had read the LQS paper and miniasm tweets - but this is a world away from what we settled for with Illumina assembly. The broad genome structure is correct, though the per-base error rate (1 every 200bp for the LQS) is higher than would be required for a “finished assembly” (1 error every 100Mb).
What does poligraph+Illumina data add to the mix? For each of these three draft assemblies, we ran poligraph using the same subset of the miseq reads (trimmed and reduced to approximately 100x).
| LQS | PBcR | Miniasm | |
|---|---|---|---|
| Aligned Bases | 99.97% | 100.00% | 92.44% |
| Percent Identity for Aligned Bases | 99.9569% | 99.9567% | 96.9092% |
| Number of Contigs | 3 | 1 | 1 |
| Number of SNPs | 112 | 185 | 54835 |
| Number of Indels | 1460 | 1580 | 79249 |
| Time to run poligraph | 6 mins | 7 mins | 13 mins |
Various observations:
- The most surprising result is that for the miniasm assembly in just 15 minutes we have created an assembly which has almost 97% identity and is structurally correct.
- Poligraph takes the %Aligned Bases up from 79% to 92% for miniasm, which is quite a leap. This almost surely means that the low percentage originally was due to many clustered SNPs rather than collapsed duplications.
- The number of miniasm SNPs drops by a factor of 100 and indels by a factor of 5
- LQS/PBcR each go up to >99.95% accuracy.
- The accuracy we get with poligraph is still not as high as that reported by Mike Schatz (99.99%), although we believe that takes a few hours to a day on a cluster, rather than 6/7 mins on a single core.
Just to finish off, here are the mummerplots for the final assemblies, including both nanopolish and poligraph polishing:
Loman-Quick-Simpson:
 and here the PBcR
 and finally the Miniasm
Looking at the mummerplots, once we allow for the fact that they will each have linearised the circular chromosome in different places, we see that all are consistent with the truth assembly.
From here onwards we did not test the LQS pipeline, as the error correction step took too long.
Dataset 2: E. coli K12 MG1655 latest chemistry:SQK-MAP-006
We reran on the latest chemistry, again courtesy of Nick Loman et al. The baseline results for the two methods we now restrict to are:
| PBcR | Miniasm | |
|---|---|---|
| Aligned Bases | 100% | 92.73% |
| Percent Identity for Aligned Bases | 99.10% | 88.53% |
| Number of Contigs | 1 | 1 |
| Number of SNPs | 876 | 182693 |
| Number of Indels | 40710 | 338240 |
Quite amazing - the unpolished PBcR assembly is now over 99% identity. (Results for the PCR and PCR-free runs were almost identical - actually need to check which these results are).
If we add poligraph:
| PBcR | Miniasm | |
|---|---|---|
| Aligned Bases | 100% | 94.18% |
| Percent Identity for Aligned Bases | 99.88% | 95.62% |
| Number of Contigs | 1 | 1 |
| Number of SNPs | 121 | 70786 |
| Number of Indels | 5200 | 124751 |
So this all looks great so far, but we were keen to test these methods on samples we had studied in detail. We therefore tried the PBcR pipeline and miniasm on 2 clinical samples described below.
Dataset 3: clinical E.coli sample
This was a clinical isolate from a study of Nicole Stoesser’s (http://biorxiv.org/content/early/2015/11/06/030668) where we had a high quality PacBio assembly which had been polished with Illumina data. The nanopore reads are mid-submission to the ENA, we’ll update this blog when we have an accession id.
[Edit: added 22nd December: This dataset contained 551Mb of 2d reads, so ~110x coverage. Mean/median/max read lengths were 5089/4981/24272bp.]
Results for the nanopolished assemblies (without poligraph)
| PBcR | Miniasm | |
|---|---|---|
| Aligned Bases | 99.98% | 99.97% |
| Percent Identity for Aligned Bases | 99.72% | 98.25% |
| Number of Contigs | 12 | 17 |
| Number of SNPs | 797 | 19324 |
| Number of Indels | 13480 | 72019 |
Unlike the K12 Loman dataset, here all the assemblers fail to produce a single-contig assembly.
If we replace nanopolish with poligraph polishing, we get the following:
| PBcR | Miniasm | |
|---|---|---|
| Aligned Bases | 99.96% | 99.11% |
| Percent Identity for Aligned Bases | 99.9% | 98.70% |
| Number of Contigs | 12 | 17 |
| Number of SNPs | 170 | 21881 |
| Number of Indels | 3370 | 40751 |
Note that although this is an unambiguous improvement for the PBcR assembly, and for the miniasm indels, it actually makes the number of SNPs in the miniasm assembly slightly higher. We’ll have to look into that.
Finally, if we ue both polishers (nanopolish and poligraph), the results are better than with either alone
| PBcR | Miniasm | |
|---|---|---|
| Aligned Bases | 99.98% | 99.97% |
| Percent Identity for Aligned Bases | 99.98% | 99.86% |
| Number of Contigs | 12 | 17 |
| Number of SNPs | 104 | 1147 |
| Number of Indels | 811 | 3826 |
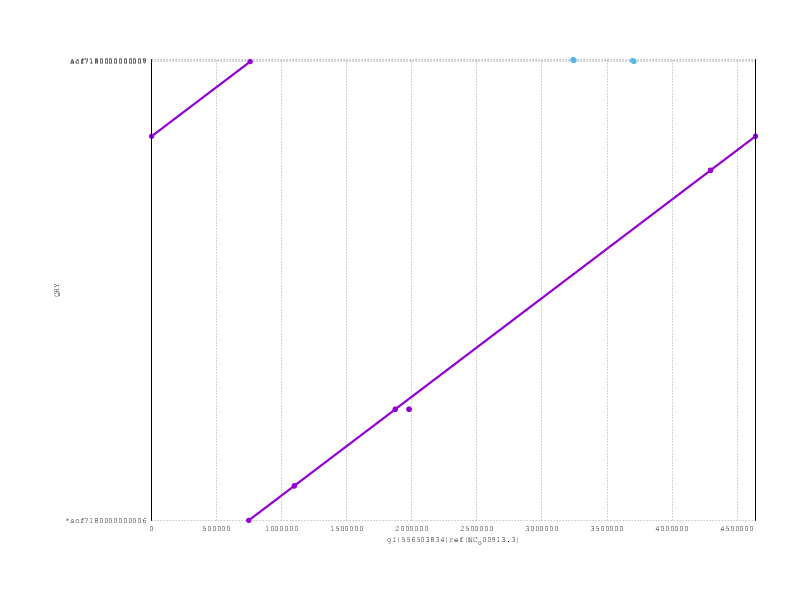
Looking at a mummerplot of the alignment of the polished miniasm assembly against the reference, we see an inversion
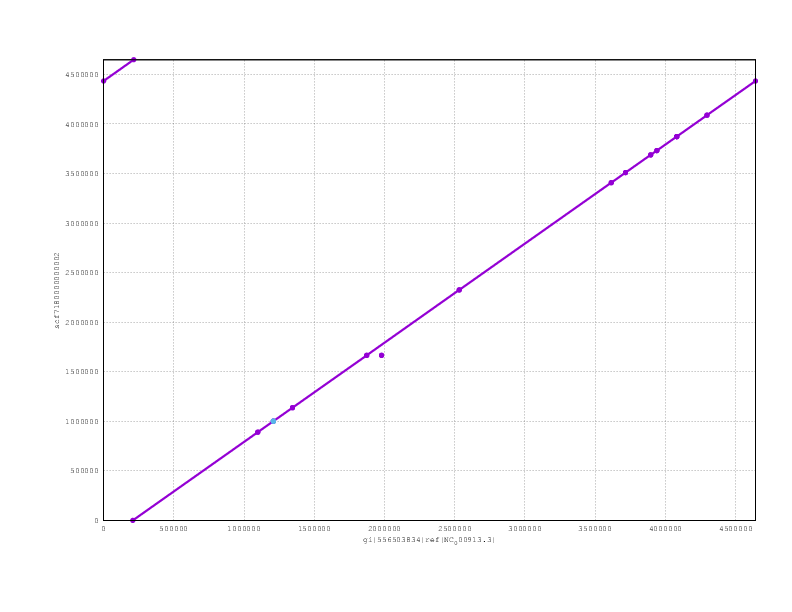
We align the (polished) miniasm and PBcR assemblies against each other, to see if they agree:
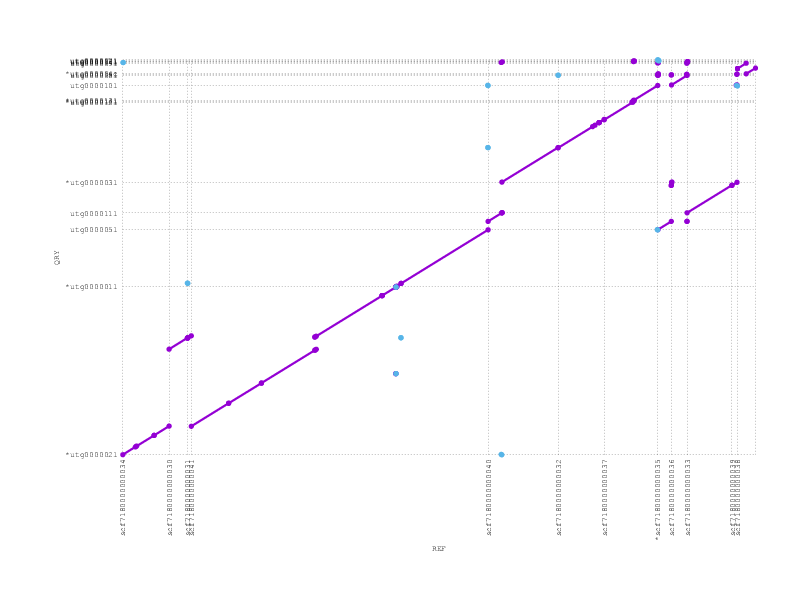
These plots can be a little confusing (many thanks to Adam Phillippy for some patient emails helping us through some interpretation), but we see that they are almost entirely consistent, supporting the possibility that the inversion we see with respect to the reference/truth is real.
Dataset 4: clinical K.pneumoniae sample
The second clinical sample was a K. pneumoniae clinical isolate with 4 plasmids. We had 54x of coverage of 2D reads.
[Edit: added 22nd December: This dataset contained 108Mb of 2d reads, so ~22x coverage. Mean/median/max read lengths were 3769/3171/40378 bp.]
Table of results for the raw unpolished assemblies
| PBcR | Miniasm | |
|---|---|---|
| Aligned Bases | 99.93% | 92.78% |
| Percent Identity for Aligned Bases | 98.38% | 87.2% |
| Number of Contigs | 13 | 28 |
| Number of SNPs | 3160 | 249564 |
| Number of Indels | 83092 | 453190 |
and the results once you add nanopolish are below (for PBcR only, nanopolish on miniasm too slow)
| PBcR | Miniasm | |
|---|---|---|
| Aligned Bases | 99.98% | |
| Percent Identity for Aligned Bases | 98.68% | |
| Number of Contigs | 13 | 28 |
| Number of SNPs | 1804 | |
| Number of Indels | 14316 |
If we add poligraph polishing instead of nanopolish, we get:
| PBcR | Miniasm | |
|---|---|---|
| Aligned Bases | 99.98% | 97.79% |
| Percent Identity for Aligned Bases | 99.84% | 97.94% |
| Number of Contigs | 13 | 28 |
| Number of SNPs | 313 | 37606 |
| Number of Indels | 6897 | 68662 |
and again, combining both polishers gives the best results for PBcR - we haven’t had time to run nanopolish on the miniasm assembly.
| PBcR | Miniasm | |
|---|---|---|
| Aligned Bases | 99.98% | |
| Percent Identity for Aligned Bases | 99.95% | |
| Number of Contigs | 13 | 28 |
| Number of SNPs | 142 | |
| Number of Indels | 1279 |
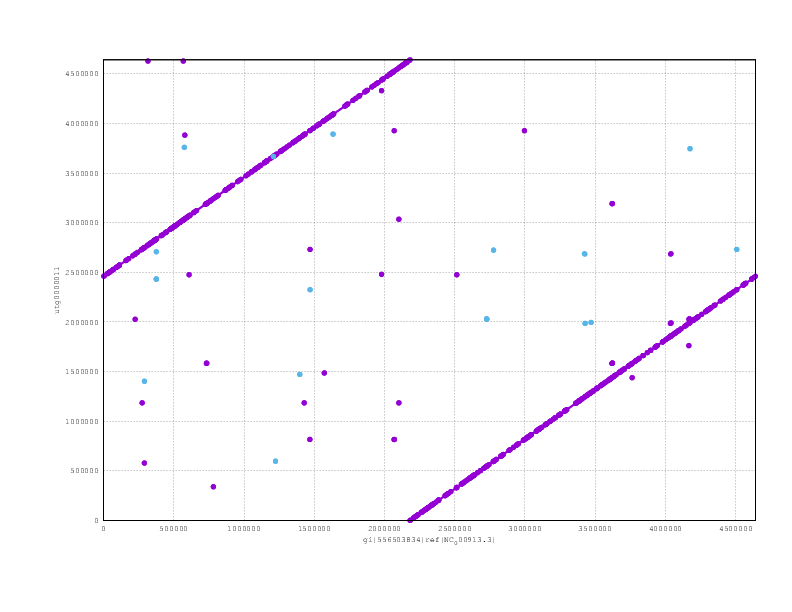
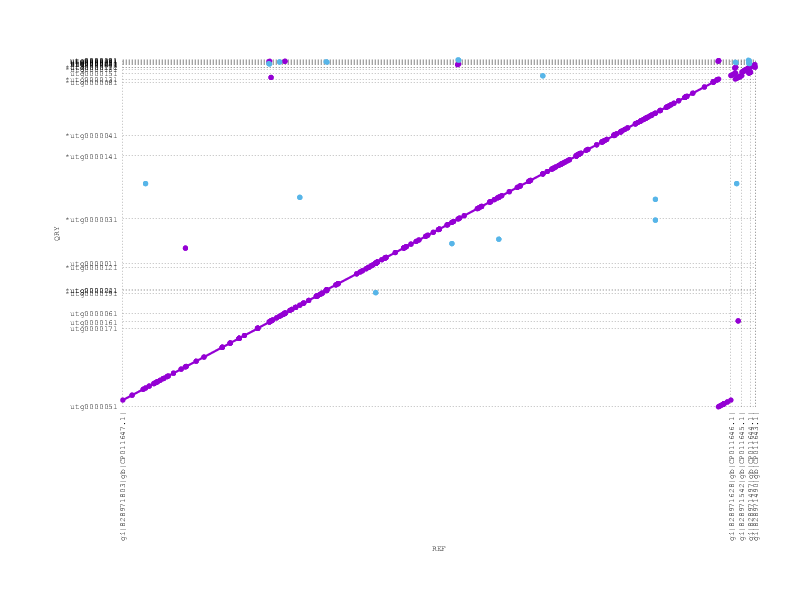
If we look at the alignment of the PBcR against the truth, we see a small inversion but otherwise full agreement
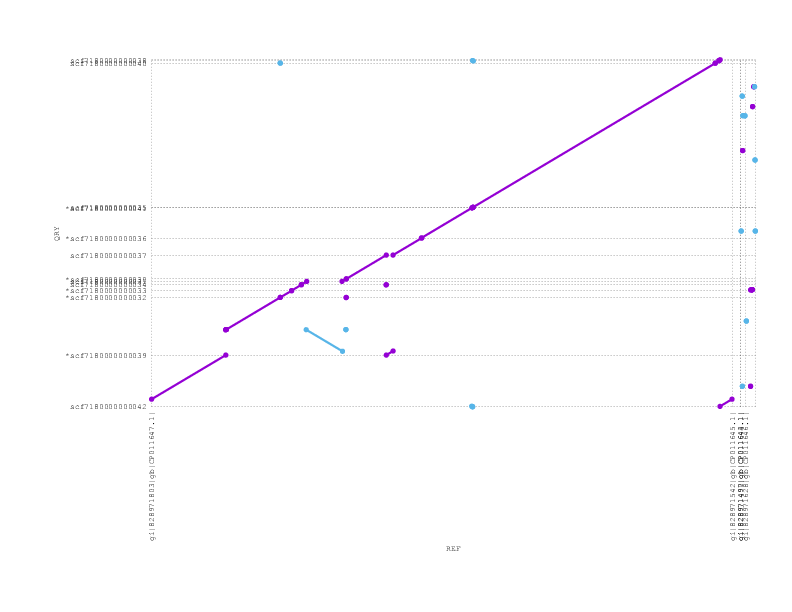
and miniasm (which does not see/support the inversion)
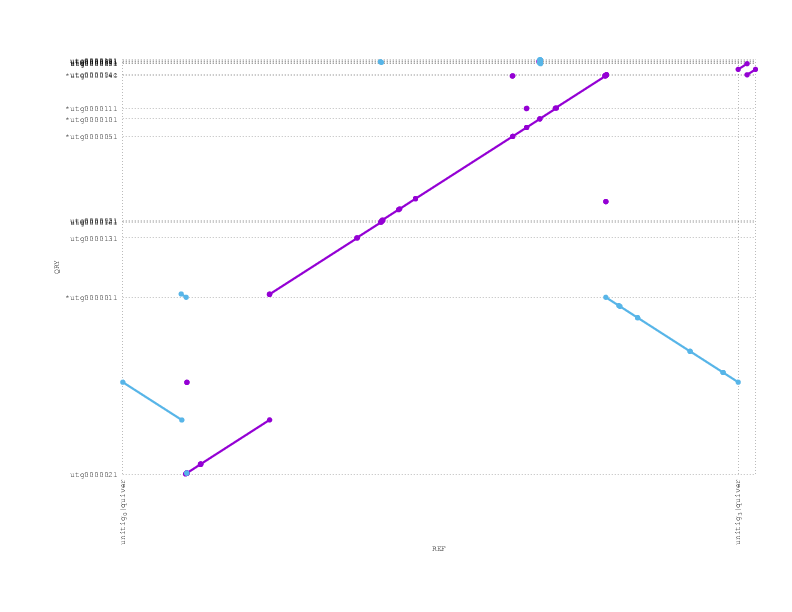
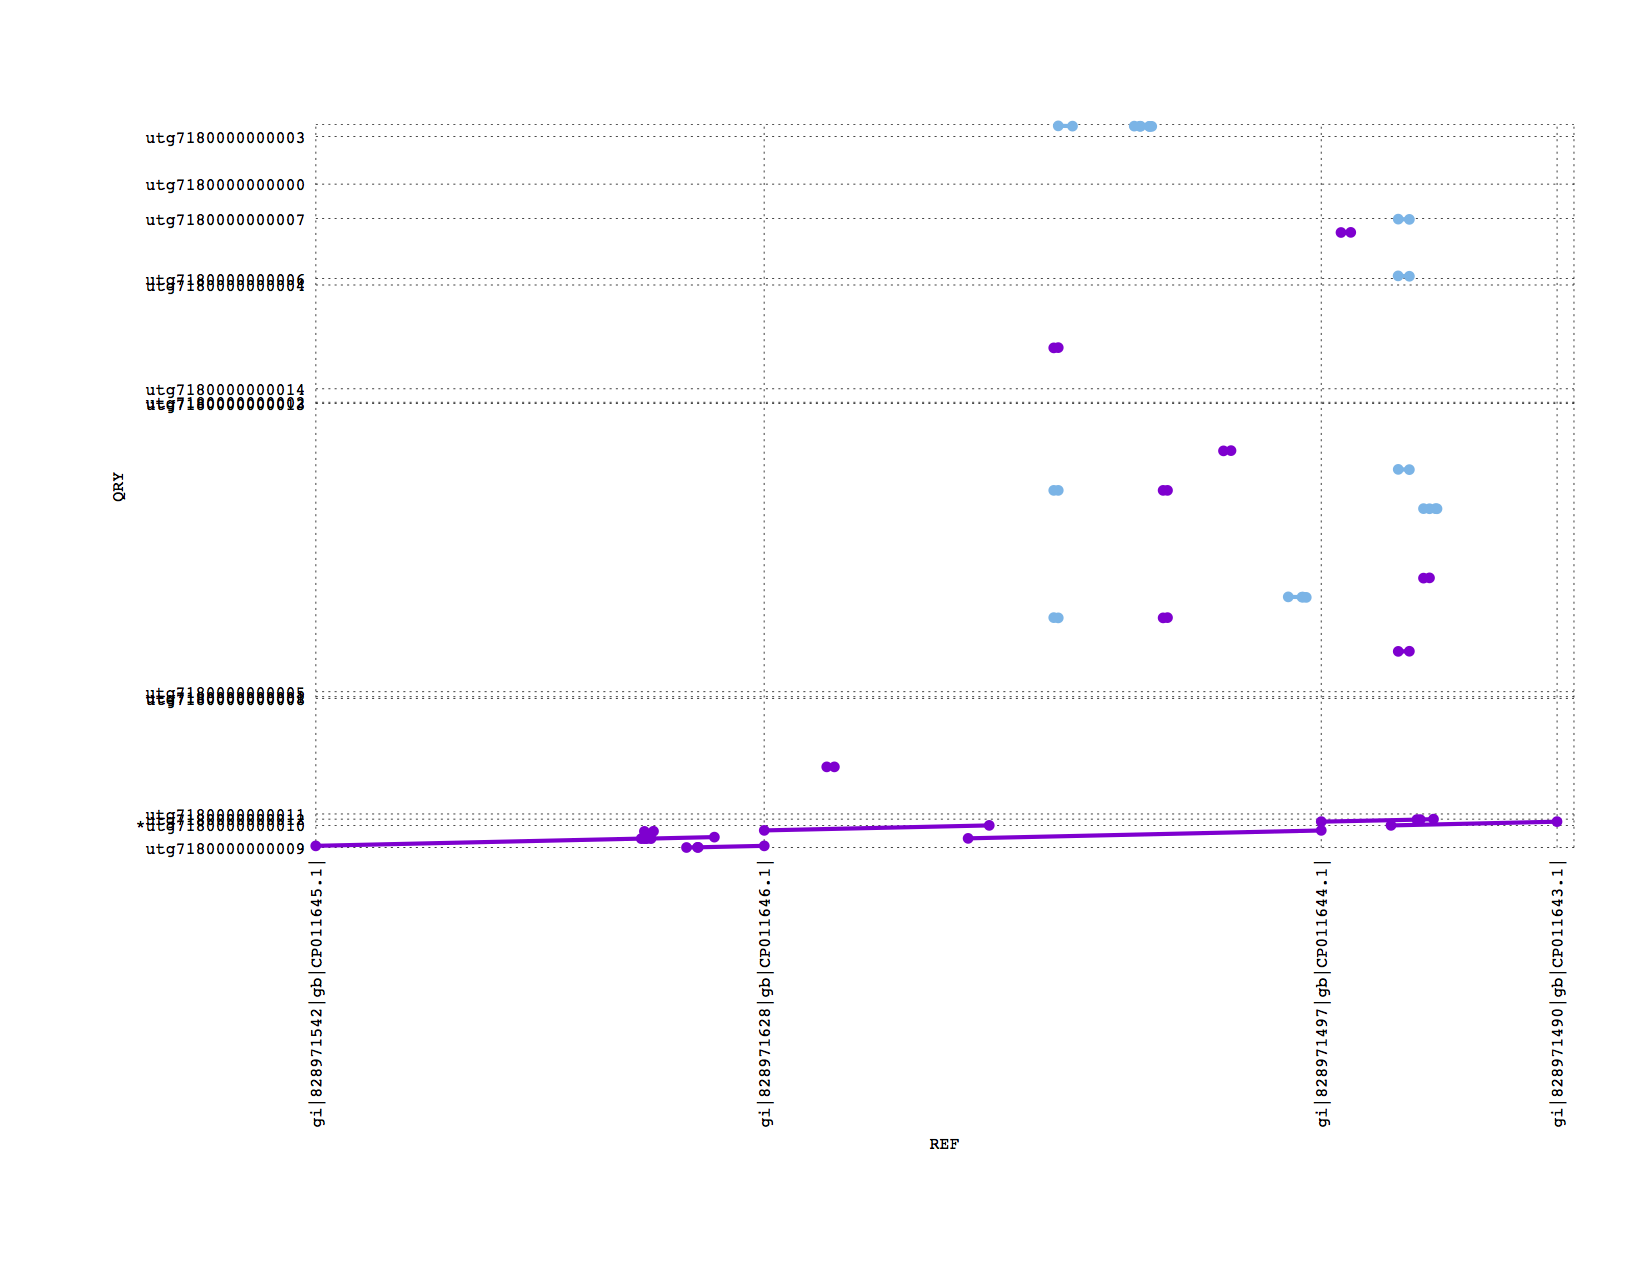
If we zoom into look at the 4 plasmids in this sample, we see Miniasm has recovered the 3 large plasmids but lost the tiny one (which could easily be due to sample preparation)
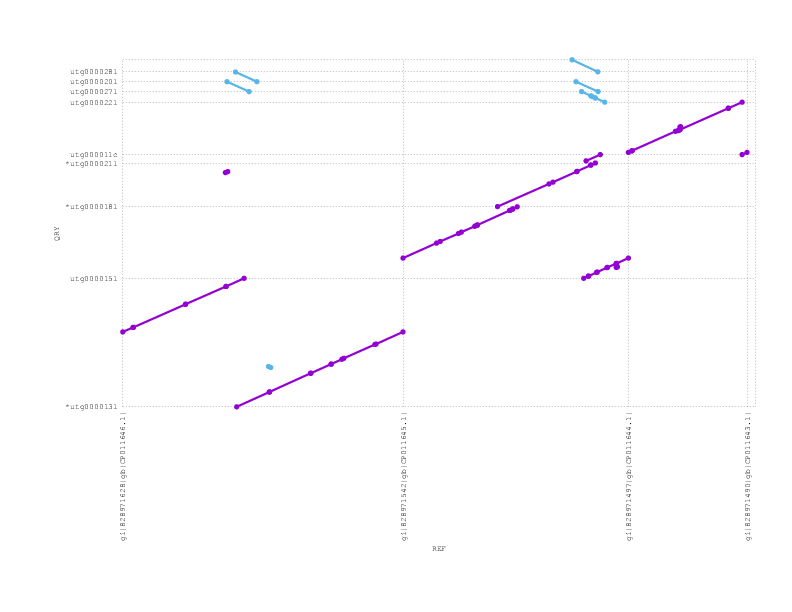
PBcR also recovered the 3 long plasmids (this is not such a good zoom figure, sorry):
Conclusions
We were struck by the consistency and correctness of the LQS, PBcR and Miniasm assemblies - completely in contrast to the short read assembly world. Polishing using the electrical event-level information in nanopore data clearly works, though it is currently slow enough to mean the whole process is no faster than an Illumina run. However, that could change quite rapidly with performance modifications to the software. PBcR comes out as the winner as far as we can see, but the blistering speed of miniasm, plus the fact that it is only a few weeks old, are extraordinarily impressive.
For those who need higher accuracy than can currently be achieved with nanopore data, poligraph polishing with illumina data offers accuracies of up to 99.9% extremely rapidly. Both miniasm and PBcR did a decent job of reconstructing plasmids in the K. pneumoniae dataset, which we thought might be challenging as we knew there was a transposon there in 2 copies, one on each of two of the plasmids.
However, one thing we do notice is that unlike the K12 long-term cultured sample, none of the assemblers succeeded in assembling the two clinical samples into a single contig. [Edit: added 22nd December: for the Klebsiella example this could be due to only having 22x of coverage, but for the E. coli sample we had 110x]
Some things we plan to do:
- Test whether local assembly (using poligraph in windows across the assembly) results in better polishing
- Get the numbers for miniasm+nanopolish
- Take a look at how poligraph compares with pilon
- Compare with the Schatz pipeline which can achieve accuracies up to 99.99%.
- Go back and italicise the Latin species names
- Update this blogpost when the submission to the European Nucleotide Archive (ENA) of the nanopore reads for our clinical samples has completed.
This has not been a full and systematic benchmarking of the many tools available. Ivan Sović et al have also done an in depth comparison of several hybrid and non-hybrid assemblies of this dataset, although they stop at the draft assembly stage. We should really have compared with a Spades hybrid assembly also, but life is short and Christmas around the corner.
Thanks
Finally, we’d like to thank a number of people: Anna Sheppard and Nicole Stoesser at Oxford for providing clinical samples for sequencing, and high quality PacBio assemblies to compare with, Adam Philippy for many emails discussing and debugging, and Nick Loman, Josh Quick and Jared Simpson for making their data available, and on multiple chemistries.